A Machine Learning Vibration-Based Methodology for Robust Detection and Severity Characterization of Gear Incipient Faults Under Variable Working Speed and Load
By Dimitrios M. Bourdalos and John S. Sakellariou
4. Experimental Assessment
4.1. Gearbox, Gear Fault Scenarios and Vibration Signals
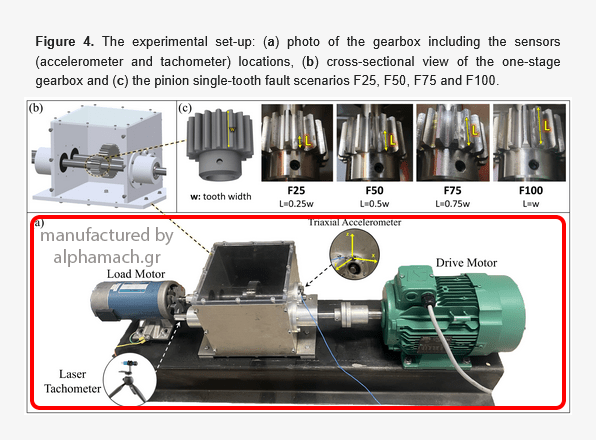
The experimental dataset has been acquired by the authors at the University of Patras, Greece. The set-up (Figure 4a), manufactured by ‘alphamach.gr’, consists of a single-stage spur gearbox driven by an AC electric motor and loaded by a DC motor. The gearbox features a pinion with 17 teeth and a gear with 34 teeth. The drive motor operates at 61 distinct speeds, ranging from 10 rev/s (1200 rpm) to 25 rev/s (1500 rpm) in increments of 0.25 rev/s (15 rpm), regulated by a standard variable frequency drive (inverter). The load motor operates as a generator, allowing adjustable loading conditions for the gearbox. Four different load scenarios are implemented: For Load 1, the load motor is detached from the gearbox. For Load 2, the load motor is attached to the gearbox but remains unloaded (no devices are connected to the generator’s outputs). In Load 3, the load motor is attached to the gearbox and a 500-watt device is connected. Finally, in Load 4, the load motor is attached to the gearbox with a 1000-watt device connected. An incipient fault is introduced at the base of a single pinion tooth in the gearbox (Figure 4b) using a typical Dremel-type cutting tool. The fault scenarios are implemented at four distinct severity levels, each defined as a percentage of the total tooth face width (w) affected (see Figure 4c). The first level corresponds to 25% of the tooth face width affected (𝐿1=0.25𝑤), the second to 50% (𝐿2=0.5𝑤), and the third and fourth to 75% (𝐿3=0.75𝑤) and 100% (𝐿4=𝑤), respectively. The above fault scenarios are designated as F25, F50, F75 and F100, respectively. It is worth noting that the faults have been introduced on the gears inside the gearbox without disassembly, thus avoiding additional uncertainties.

Figure 4. The experimental set-up: (a) photo of the gearbox including the sensors (accelerometer and tachometer) locations, (b) cross-sectional view of the one-stage gearbox and (c) the pinion single-tooth fault scenarios F25, F50, F75 and F100.
Vibration signals are acquired using a single triaxial accelerometer placed on the ball bearing housing of the secondary shaft (see Figure 4a). The signals are sampled with a sample frequency of 𝑓𝑠=10,240 Hz, and only z-direction (radial axis aligned with the gravitational direction) measurements are employed based on the fact that they typically exhibit the strongest sensitivity to spur gear faults [53,54,55]. Additionally, a laser tachometer measures simultaneously the rotating speed of the drive motor (see Figure 4a). A total of 18,765 vibration signals are recorded (see details in Table 1) including all considered health states, rotating speeds and loads. Only 465 of them (2.5% of the complete dataset) are employed for the training of the ML methodology, while the remaining 18,300 signals (97.5%) are exclusively used in the inspection (testing) phase for the methodology’s assessment and comparison.
Read the full article…